Tag: Visual edit |
Tag: Visual edit |
||
| Line 119: | Line 119: | ||
[[File:River Tool.jpg|none|thumb|279x279px|An example of the River Tool.]]There are a number of modifications available for the River drawing Line Tool. These include: |
[[File:River Tool.jpg|none|thumb|279x279px|An example of the River Tool.]]There are a number of modifications available for the River drawing Line Tool. These include: |
||
*Tapering the width of the river by selecting this option in the Edit Terrain tab: [[File:Tapered River.jpg|none|thumb|220x220px|Select the left chevron (<) to make the river increase in width along the length of the river. Select the right chevron (>)) to make the river begin wide and decrease in width along the length of the river. Select the button (-) to make the river the same width along the entire length of the river. Click to enlarge.]] |
*Tapering the width of the river by selecting this option in the Edit Terrain tab: [[File:Tapered River.jpg|none|thumb|220x220px|Select the left chevron (<) to make the river increase in width along the length of the river. Select the right chevron (>)) to make the river begin wide and decrease in width along the length of the river. Select the button (-) to make the river the same width along the entire length of the river. Click to enlarge.]] |
||
| − | * Adjusting the (base) width of the line:[[File:Pen Width.jpg|none|thumb|220x220px|If you are using a digitizing |
+ | * Adjusting the (base) width of the line:[[File:Pen Width.jpg|none|thumb|220x220px|If you are using a digitizing pen you can make the width of the river correspond to the amount of pressure used while drawing the river. Hover the cursor over the River line tool and the MAX width display will appear. You can adjust the MAX width by scrolling the middle wheel on the mouse.]] |
===== '''The Fortification / Wall Drawing Tool''' ===== |
===== '''The Fortification / Wall Drawing Tool''' ===== |
||
Revision as of 12:47, 30 November 2018

General Staff Wargaming System Map Editor Demo
Map Editor Overview
The General Staff Black Powder Map Editor (hence referred to as the Map Editor) allows you to create new battlefield maps for use with the General Staff Black Powder Wargaming System. In many ways the Map Editor is a traditional multi-layered paint program with similar functionality as popular paint programs like PhotoShop,
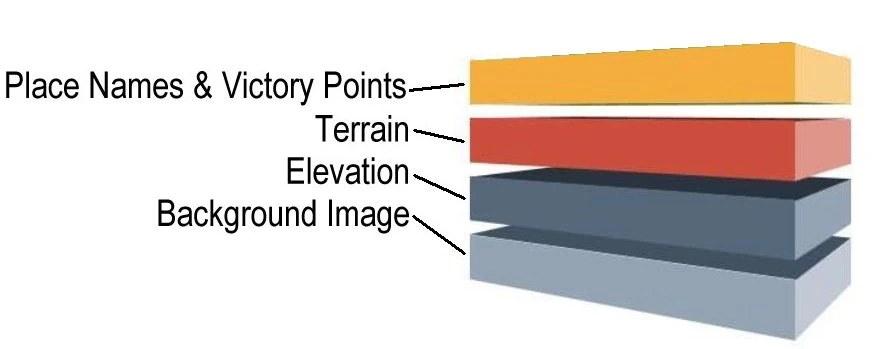
In the above schematic image we see that there are four possible layers in a General Staff battlefield map: Place Names & Victory Points (optional), Terrain, Elevation and Background Image (optional).
After a map is created and saved in the Map Editor it can be loaded into the General Staff Black Powder Scenario Editor and used to create new or historical battles that are then played in the General Staff Black Powder Wargame. It is important to remember that how your map looks when it is saved (with terrain and elevation opacity settings) is how it will appear in the game.
You will be drawing Terrain Objects (such as forests, lakes, roads, etc.) on your map. These objects can be individually deleted or merged with similar terrain objects.
You also have the ability to import digital scans of historical battlefield maps, add terrain and elevation data, and save the map for use with the General Staff Wargaming System.
What the Map Editor Produces
The Map Editor produces four things every time you select 'save' or 'save as':
1) A jpg picture which is a visual representation of terrain for the user. This image is exactly what the user sees at the moment that the file is saved. It is a combination of the background, terrain and elevation layers each effected by the level of opacity set by the user. In other words, What You See Is What You Get. This is the image that will appear in the Scenario Editor and in the actual General Staff Wargame.
2) A list of Places with optional Victory Points. These are displayed visually to the user and they are used to determine the 'score' and results of each battle. They usually represent strategically important locations. These are considered separately from all other terrain you draw because they don't just become part of a background jpg.
3) A matrix (two dimensional array) of terrain types. Each pixel has a value for the underlying terrain on the battlefield. This is used by the computer to tell it where a road is. The order things are added matters and last added terrain wins. Hence a road over a river defines a crossing place where your infantry will not drown.
4) A matrix (two dimensional array) of elevation. This is sometimes referred to as a 'height map'. Each pixel has a height in metres. This is used by the computer to know height.
It is due to the last three points that you cannot just grab any old map and meaningfully use that as the background. If you did then the computer would have no way of knowing what terrain is where. It'd be just a picture as far as the computer is concerned. In fact the picture is not used for any calculations by the apps.
A Note About Memory
The minimum memory and system requirements for the Map Editor is Windows 7 and 3 GB of memory. The Map Editor supports multi-threading and will take advantage of this when required to process multiple memory intensive tasks such as drawing rivers and calculating elevations. When this happens these icons (below) will appear:
When these icons appear in the upper right hand corner of the Map Editor window it indicates that processing is taking place in the background. Each icon represents a different thread.
If, when working on a minimum spec machine, drawing outlines (such as for a forest) become jerky it is an indication that you are pushing memory limitations.
Digitizing Tablets & Pens
The Map Editor supports the use of digitizing tablets and pens as well as the standard two button + scroll button mouse. You will need a scroll wheel for some functionality.
The Map Editor Screen
Upon running the Map Editor your screen will look like this:
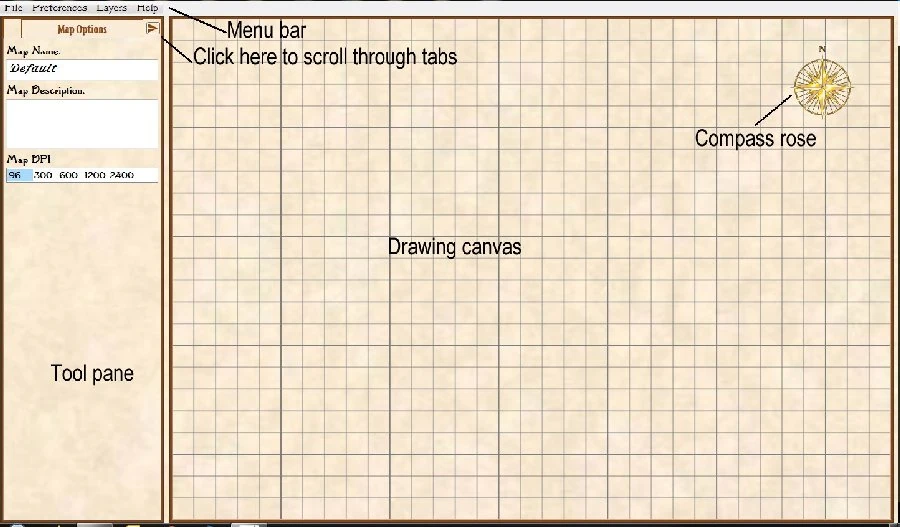
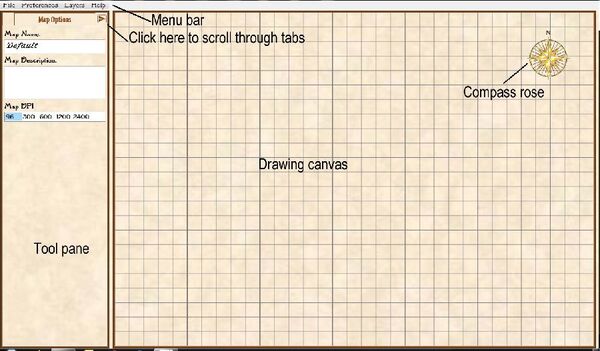
The opening screen of the Map Editor.
The screen is divided into two areas: the Tool Pane on the left hand side of the screen and the Drawing Canvas which takes up most of the screen. Above these two sections are a standard Menu Bar. The grid lines and the Compass Rose are optional and can be toggled on/off from the Layers menu.
The Tool Pane
Drawing tools, tool options and map information is entered in the Tool Pane area on the left portion of the screen. Clicking on the left or right arrows on either side of the tab title will scroll to the previous / next tab (see above image).
The Map Options Tab
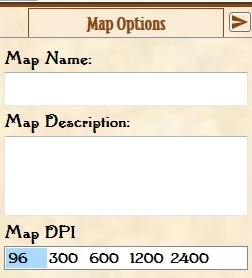
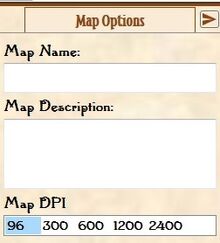
The Map Options Tab is where you enter information about the map itself. There are three options:
Map Name
The Map Name is, obviously, the name of the map. A descriptive name, like Sharpsburg, September 17, 1862 would be appropriate.
Map Description
Enter a descriptive text about the map. This information is saved with the map.
Map DPI
You can select the DPI (Dots Per Inch) resolution that the map will be saved at (either 96, 300, 600, 1200 or 2400). Remember: the greater the DPI the larger the file size! You may wish to save the map at higher DPI resolution if you intend to print out the map (very handy for board gamers) or if you have a high resolution monitor.
The Drawing Options Tab
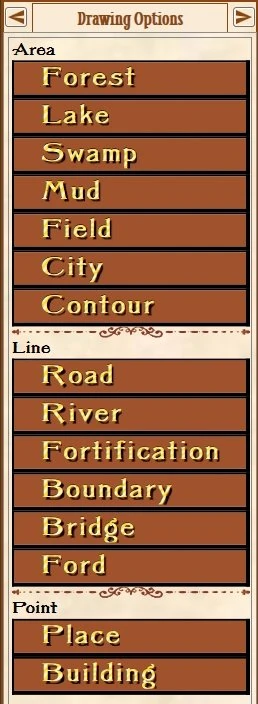
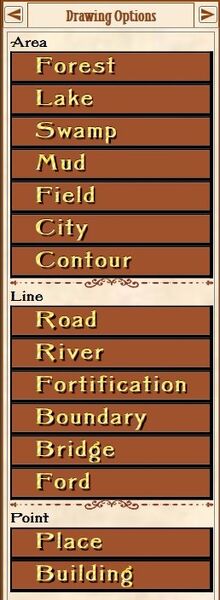
The Drawing Options tab. From this tab you can select Area drawing (Forests, Lakes, Swamps, Mud, Field, City and Contours), Line drawing (Roads, Rivers, Fortifications, Boundaries, Bridges, and Fords) and Point options (Place names and buildings).
These are the tools that you will be using to draw on the Drawing Canvas portion of the screen. When you choose to work with one of the Area or Line tools on the... Drawing Options Tab your map cursor will change to a pen:

Note: You are drawing on the Terrain Layer.
The Drawing Options Tab is divided into three sections:
Area Drawing Tools
Area Drawing Tools are tools for drawing filled in areas on the map like Forests, Lakes and Swamps. When you draw on the Drawing Canvas with an Area Drawing Tool your start and end points are automatically connected and the enclosed area is filled in with the selected terrain type.
If you are using a mouse to draw the start point is where you click down with the left mouse button. Hold the left mouse button down until you have arrived at your end point and then release the left mouse button. The start and end points are automatically connected.
If you are using a digitizing table and pen press down on the tablet with the pen at the start point, continue drawing with the pen until you reach the end point and then lift the pen off of the drawing tablet. The start and end points are automatically connected.
Setting Base Width
If you're using a stylus then the harder you press, the higher the pressure applied and the wider a line terrain will get. If you're instead using a mouse ( most users will probably only have a mouse ) the width is fixed to the value equivalent to 0.5 pressure. Pressure ranges from 0 to 1.
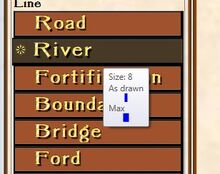
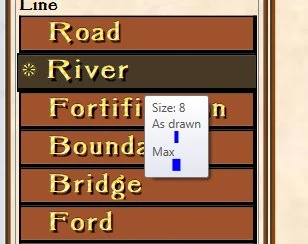
You can set the base width for each line terrain. You need a mouse or a stylus which has a scroll wheel (yes, some styli do). Position the cursor over the desired tool option (for example, River) you should see a tooltip appear like the picture below. Then use the mouse scroll wheel to increase or decrease the values. "As drawn" is 0.5 pressure and what you will get with a mouse. Max is the maximum width you will get with 1 pressure or at the end of a river you use the widening option on.
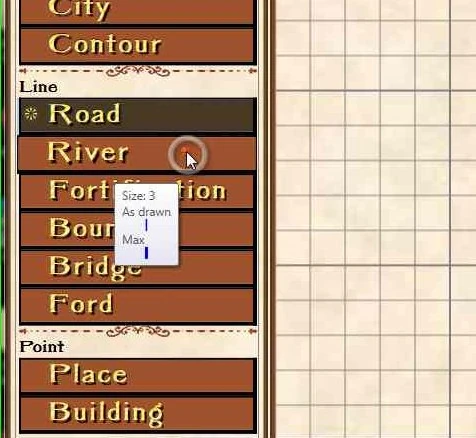
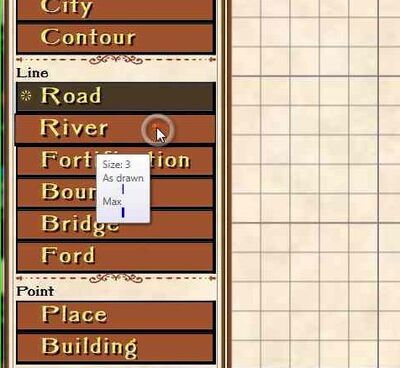
You can adjust the pressure sensitivity (min and max width) by hovering the cursor over the desired tool button and using the mouse scroll wheel to adjust the values higher or lower.
This will allow you to draw rivers that widen or decrease in width based solely on the amount you press down on the digital pen.
Selecting a Drawing Tool
You can either click an option or cycle through them using up / down arrows. Although these look rather like buttons ( for immediate familiarity ) they're not.
When you select a drawing tool the background darkens and a rosette will appear to give a visual confirmation:
A rosette to the left of the tool name indicates that this tool has been selected for drawing.
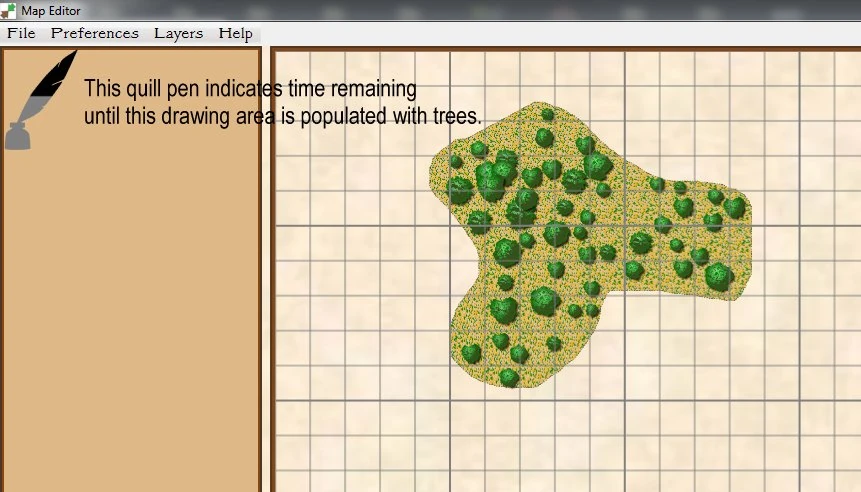
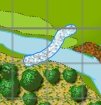
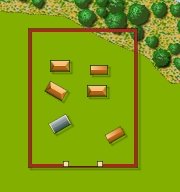
Forest Drawing Tool
An example of using the Forest Drawing Tool. Note the quill pen indicates progress adding the trees as "children" of the forest. The process which adds the trees calculates how many to add based on area. It looks for a space to fit one by randomly picking a point and checking whether there's a tree there already. As trees are added there are less and less points "free" and finding a new space takes a bit longer. The size of the trees is reduced as you go but you will notice it can take quite some time for large complex forests.
This mechanism of adding "children" is used in other area tools ( waves for lakes ) except there are less children and they will usually run much faster.
The Lake Drawing Tool
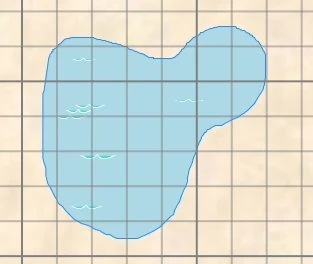
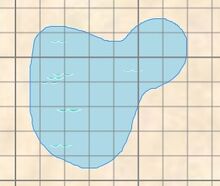
An example of a lake drawn with this tool.
The Swamp Drawing Tool

An example of a swamp drawn with this tool.
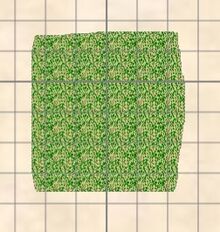
The Mud Drawing Tool

An example of the Mud Tool.
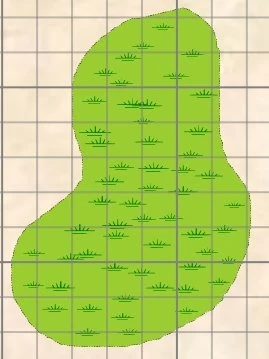
The Field Drawing Tool
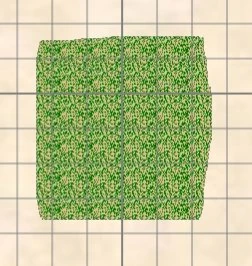
An example of the Field tool
The City Drawing Tool

An example of the City tool. See below for methods to change the city image.
The Contour Drawing Tool
An example of contours.
Use the Contour Drawing Tool to draw elevation contours (above). Important: this tool does not add elevation to the map. That is done either by importing Elevation Data or Drawing Elevation Data (see below)
Line Drawing Tools
Line drawing tools are different than Area Drawing Tools (see above) in that the start and end points of the line are not automatically connected.
The Road Drawing Tool
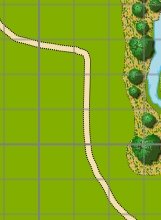
An example of the Road Tool.
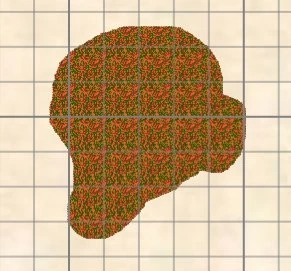
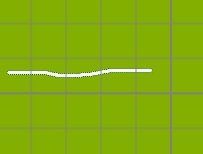
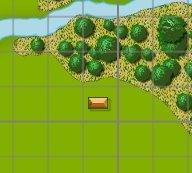
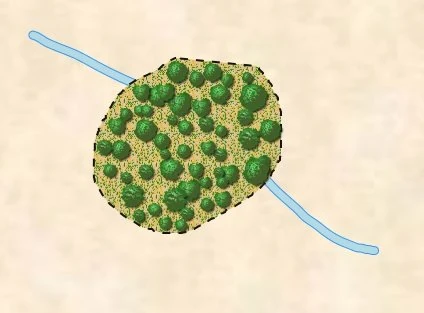
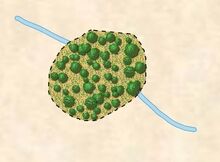
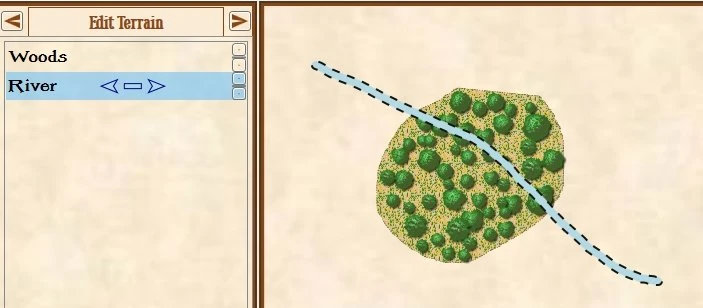
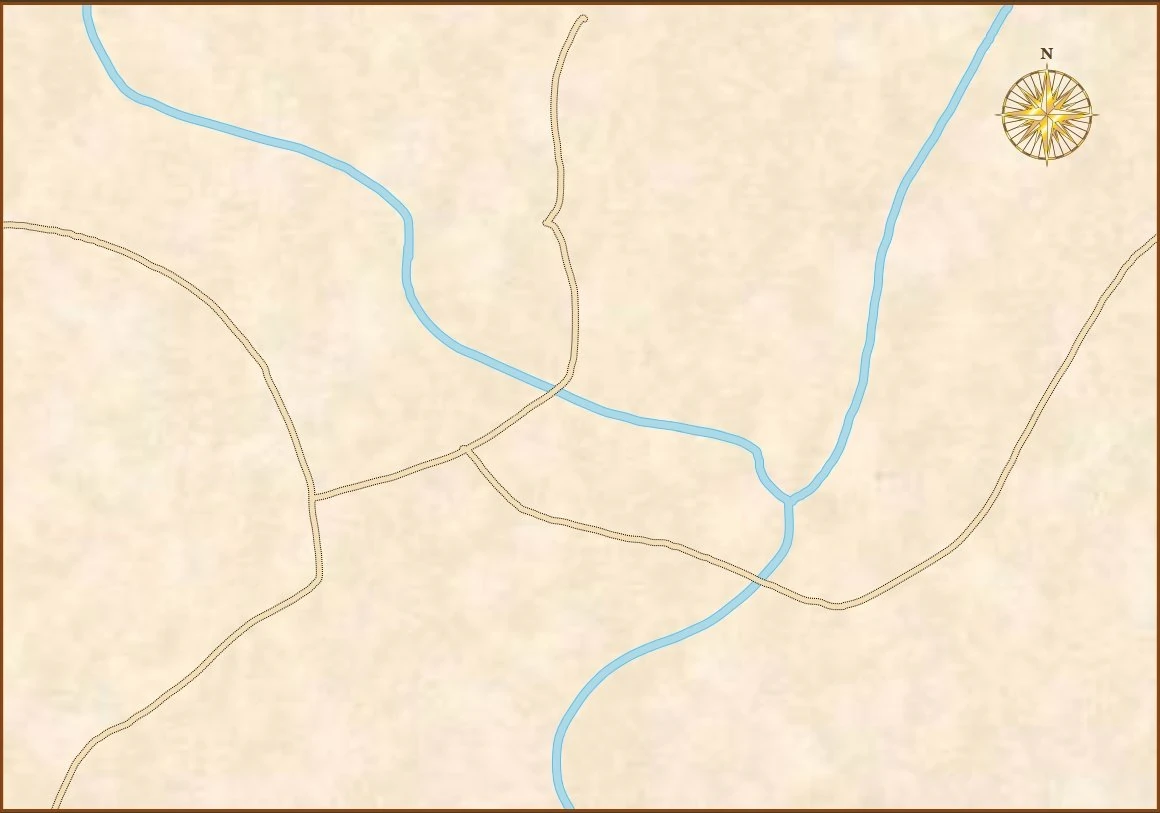
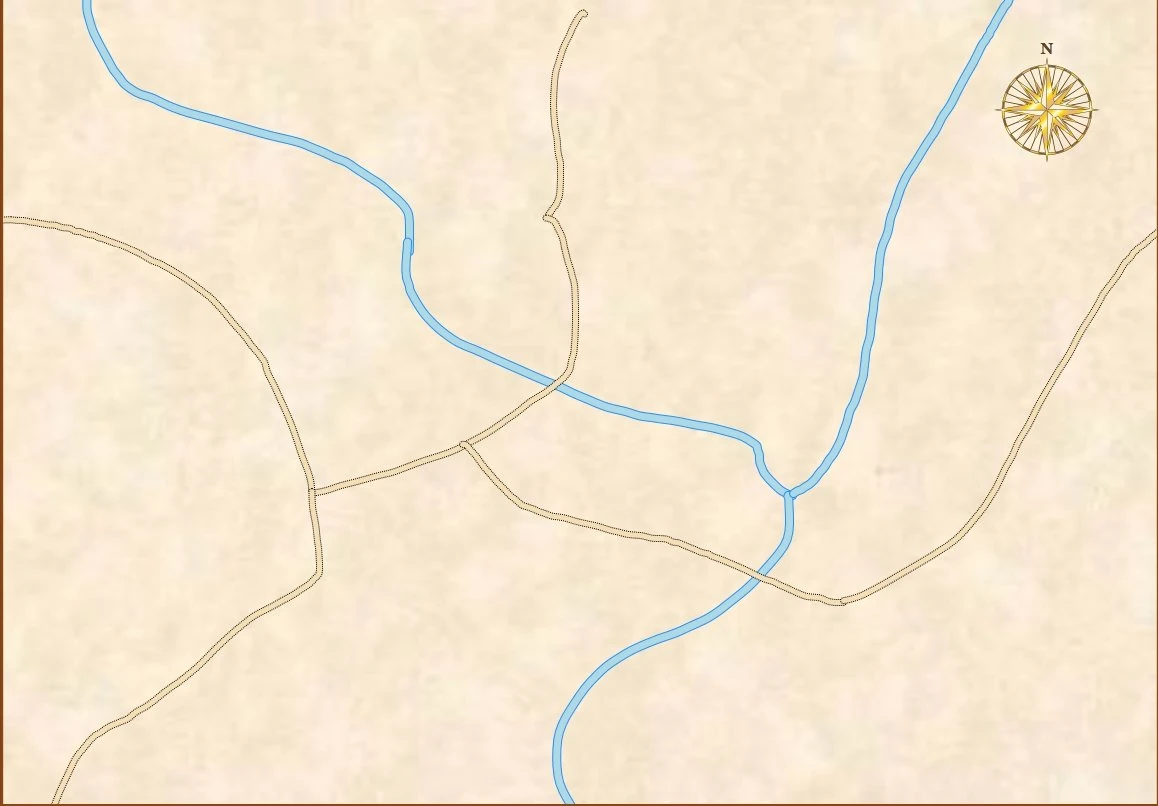
The River Drawing Tool
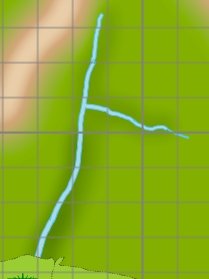
An example of the River Tool.
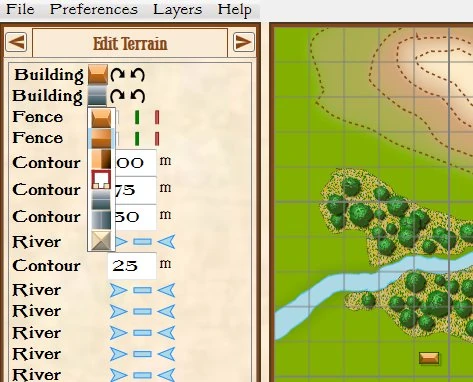
There are a number of modifications available for the River drawing Line Tool. These include:
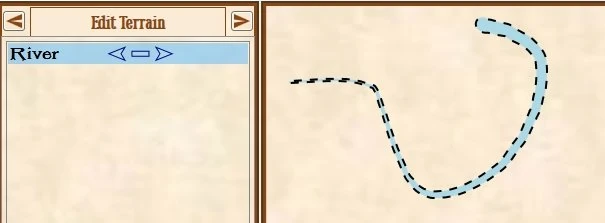
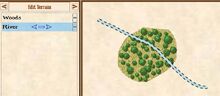
- Tapering the width of the river by selecting this option in the Edit Terrain tab:


Select the left chevron (<) to make the river increase in width along the length of the river. Select the right chevron (>)) to make the river begin wide and decrease in width along the length of the river. Select the button (-) to make the river the same width along the entire length of the river. Click to enlarge.
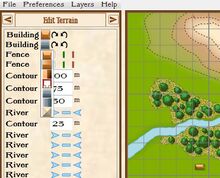
- Adjusting the (base) width of the line:
If you are using a digitizing pen you can make the width of the river correspond to the amount of pressure used while drawing the river. Hover the cursor over the River line tool and the MAX width display will appear. You can adjust the MAX width by scrolling the middle wheel on the mouse.
The Fortification / Wall Drawing Tool
An example of the Fortification Tool.
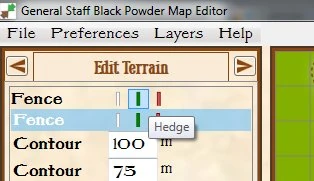
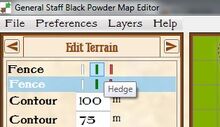
The Boundary Drawing Tool
An example of the Boundary Tool. Note: the default type for boundary is Fence.
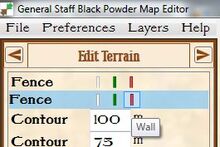
Once you have drawn with the Boundary Tool you can go to the Edit Terrain tab and change its type from Fence to Hedge.
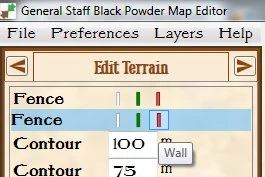
Once you have drawn with the Boundary Tool you can go to the Edit Terrain tab and change its type from Fence to Wall.
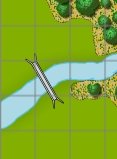
The Bridge Drawing Tool
An example of the Bridge Tool. Note: click and drag to draw the bridge over the river. The bridge will extend until you let up on the mouse or drawing pen.
The Ford Drawing Tool
An example of the Ford Drawing tool. Note: click and drag to extend the length of the ford over the river.
The Point Drawing Tools
With Point drawing tools you click once on the map to add something centred at that point. These are places or buildings.
Places are either just labels or a label and plaque containing victory points you can win by occupying the area with a unit in simulation mode.
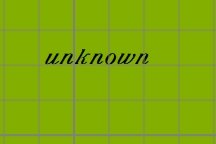
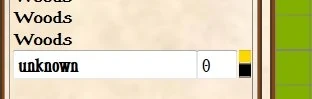
When you add a place you initially start with a default "unknown" plain label
The Placename / Victory Point Drawing Tool
When you click on the map with the Place tool the text 'Unknown' appears on the map.
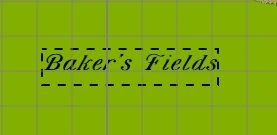
Go to the Edit Terrain tab and change the text to desired label. You can also change the color of the text by clicking on the color boxes and selecting either White, Yellow or Black type.

An example of a Place label. This Place has no value and is simply used to add information about the map.

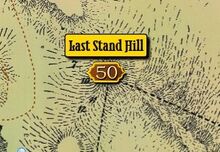
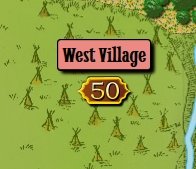
If you add a value to the Place in the Edit Tab you have created a Victory Point Area. In the example, Last Stand Hill is worth 50 Victory Points.
Victory Points can be either Yellow (not controlled by other side), or Red or Blue indicating which army last passed over this area. You can select Red, Blue or Yellow when on the Edit Terrain tab; select the Victory Point and select the color from the drop-down color box.
The Building Drawing Tool
An example of the Building Tool. Click on the location on the map where you wish to place a building.
After placing a Building on the map go to the Edit Terrain Tab. There you can select different kinds of building types and rotate the building to the left or right.
Examples of various Buildings inside an enclosed area.
The Edit Terrain Tab
Once you have added at least one terrain then you will see it appear in the list on the Edit Terrain Tab.
You will have various options in the left pane for each terrain.
In the right, you can right click area terrains and choose one of three options.

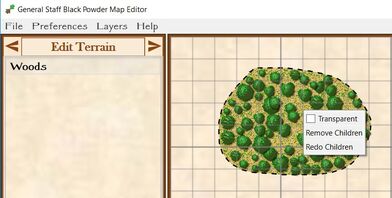
Removing the children will remove the trees, redoing the children will remove and then re-fill with trees and setting the background transparent will remove the speckled fill.
The latter is particularly useful if you already have a background map which includes imagery you wish to retain. This could be a forest or city on a map out a history book or scan that you're using as background.
To change the order in which terrain is drawn.
Whatever terrain is drawn last is on the top. For example, if you draw a river and then a forest over the river, it will look like this:
If you first draw a river and then draw a forest over the river it will look like this. Probably not want you wanted. Click to enlarge.
However, you can change the order in which terrain is drawn by selecting the desired terrain on the Edit Terrain tab and clicking either the (-) or (+) boxes. Minus will cause the terrain object to be drawn later. Plus will make the terrain object drawn sooner. For example:
This is the result of selecting River in the Edit Terrain tab and clicking on the (-) box. This has the effect of drawing the river on top of the forest. Click to enlarge.
To change the direction of the Compass Rose
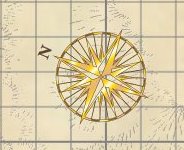
Compass Rose rotated.
When the Edit Terrain tab has been selected, position the cursor over the Compass Rose in the upper right hand corner of the map. Use the mouse scroll wheel to move the Compass Rose clockwise or counter-clockwise.
The Obtain Elevation Data Tab
( Preliminary write up ).
This tab uses data from Google Maps. In order to use this (optional) functionality you will need to create a Google Maps Platform account. The relationship for this service is of course between you and Google. The details of this have been subject to recent change, but are explained:
https://cloud.google.com/maps-platform/
Although you register a credit card, the service is effectively free for normal usage since you get $200 "credit" each month. If you want to create many maps using this service then use Google's pages to check usage. Current costing is $5 per 1,000 calls. A map's worth of data is 579 calls.
You will be given a unique id which is necessary to call the service.
Once you have registered and have this long string of characters and numbers, create a txt file ( notepad ) called googlekey in:
%localappdata%/generalstaff
The reason this is a manual process external to GeneralStaff is to ensure you understand this is not part of our code you will be using.
Google's Elevation API is by far the most convenient source of real world elevation data but rather quirky. Presumably due to past abuses the service was sensitive to the high number of calls necessary for our purposes. Until recently it was taking two runs to obtain a full map's worth of data. If the download stops mid run, save your map and try again several hours later to obtain the rest. If you try immediately and the failure was because Google decided you were asking for too much data, it will always fail.
On the plus side the recent change to force credit card registration seems to have allowed them to remove or reduce the sensitivity of the usage checks.
Elevation Data Alternatives
You might think that Google's elevation api is a bit of a nuisance what with the registering and sensitivity.
Which it is.
So why on earth are we using it?
That's because it works reasonably predictably, offers effectively 100% coverage and is easy to use. The alternatives fail on most or all of these criteria. I could probably write something much more user friendly with no registration and zero cost. The problem is that would be a significant project of itself. Downloading, translating, securing and providing a convenient UI to provide elevation data would take substantial effort. The necessary hosting would probably also necessitate passing charges on to you the user.
The GrayScale Elevation Tab
This uses contours or an imported picture to work out elevations.
The contours are those you draw ( covered above ).
A picture can be any jpg or png picture which will be converted to 255 shades of grey internally. Although inadvisable, you could theoretically use a colour picture. Whichever picture you choose will be stretched to 1155 x 805 px.
For most predictable ad precise results it is therefore advisable to use a greyscale picture which is 1155 x 805.
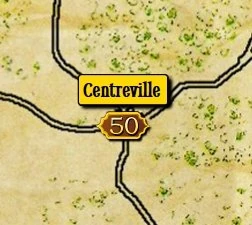
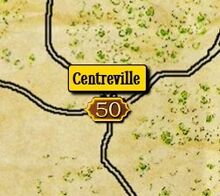
Example of a GrayScale or HeightMap:

The Centreville battlefield created by Ed Isenberg for use with the General Staff Wargaming System. Click to enlarge.

The height map or GrayScale map that represents the elevation for the Centreville map. Note that the lighter areas are higher elevations.
This video tutorial shows how to import scanned maps into the General Staff Wargaming System and how to create GrayScale Height Maps with Adobe PhotoShop:

Importing a Scanned Map Tutorial
How to import historic maps into the General Staff Wargaming System and how to use Adobe PhotoShop to create GrayScale height Maps video tutorial.
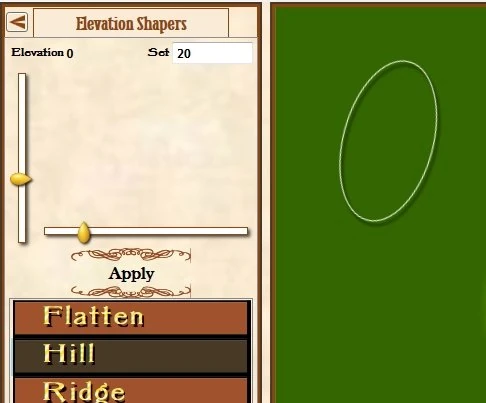
The Elevation Shapers Tab

The Elevation Shapers tab. Click to enlarge.
The name stems from "clay shapers" which are art tools used for sculpture. With these you're going to sculpt your game world.
When you click the Apply button these effects are committed to the elevations in memory. You still need to choose to save the map to write the changes to disk.
Most of these effects are additive - meaning they work out a number for each "cell" falling within their effect and (when applied) will add that to whatever elevation is set for those cells.
Note that the elevations are integers and the hypsometric algorithm works out 255 gradations lowest elevation to highest.
This might not seem significant until you add a low hill on a flat map and see noticeable jaggies with quite high contrast since the low is 0 and the high 20.
A number of these tools use greyscale with blurring to give a smoothed transition.
Flatten
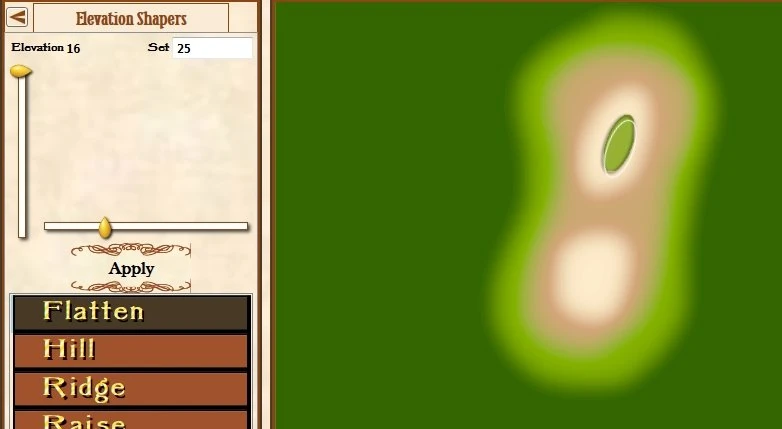
The Flatten tool. Note that the elevation has been set to 25 meters (in the Set field at the top of the Elevation Shapers tab). Click to enlarge.
This sets an ellipse to a specific height.
You could conceivably create a raised cylinder by setting an ellipse to a higher elevation to the terrain around it or lower an area similarly but this is not the intended use. The idea is you use this to flatten anomalies of some sort out of your map.
You can size the ellipse before or after you drag it onto the map.
The brass sliders control height and width.
If you hover over the ellipse you can rotate it using the mouse wheel.
This is particularly useful if you've downloaded elevation data from google for an area and it has some modern village or feature which you want to remove. EG the "Lions mound" at Waterloo is a big cone shaped hill added after the battle so it wasn't there back in 1815.
The value in "Set" will be used as the elevation for the area covered by the ellipse.
You can overtype that or right click some point on the map you've already got elevation data for.
Once you have the height you want and the ellipse is in the right position, right click the ellipse and your new value is applied.
Hill
The Hill tool. Note that it will create elevation in the oval area of the height specified in the Set field. Click to enlarge.
You can size the ellipse before or after you drag it onto the map.
The brass sliders control height and width.
If you hover over the ellipse you can rotate it using the mouse wheel.
With this your ellipse defines the outline of a rounded hill whose peak is the value in Set.
Right click will apply the effect.
The calculations for a large hill can take some time.
Ridge
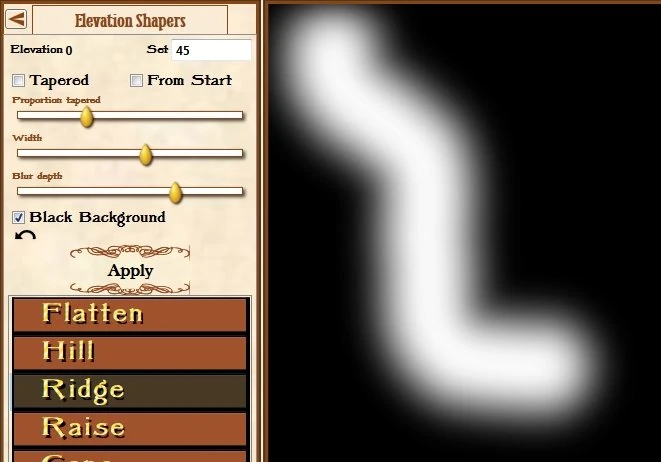

The Ridge tool. When you first create a ridge it will draw a dark red line and then calculate the ridge following the line using the defined settings. Click to enlarge.
This is a greyscale tool.
With this you draw a sort of a long hill or valley. Whilst very powerful, this tool is complicated and pretty tricky to get good results from. It is strongly recommended you use an experimental "scratch" map to explore how this works before using it for real.
Valleys are done using a negative value for Set. This will gouge an area out like you were cutting out of expanded polystyrene. Just like you'd need enough thickness in a sheet of polystyrene you should also ensure there's enough depth above zero in the map before you gouge anything out. This technique is very useful for creating river valleys.
Unpredictable results are likely if you cut a valley that ends up with negative elevation.
A natural ridge will taper and lower towards it's end.
You're using ink to draw this and pressure is used both to taper and reduce the height at the narrow end of a tapered ridge. If a skilled artist and use a stylus then this will be unexpected. For most users who just have a mouse then this is something you won't have to worry about.
You must set options before drawing but you can draw multiple ridges before clicking the apply button.
If you check the "Tapered" box then you get a narrowed lower end either at the start or end depending on whether you check the "From Start" box.
If you wanted a ridge tapered at both ends then draw two overlapping - from one end and then from the other. Then click apply.
The Proportion Tapered slider controls how much of the ridge is tapered none is with the slider to the left and all to the right.
Width is the width of the ridge.
Blur Depth increases of decreases the extent the whole set of ridges you draw is blurred and can be changed before or after you draw.
Black background allows you to easily just see what you're drawing but haven't committed using the Apply button.
The Undo arrow removes the last ridge you added. You can keep on clicking and removing until all you added but have not applied are removed.
You're likely to want to use this a lot when you're learning how ridges work.
Raise
This tool increases the elevation for ALL the cells on the map by the value you have in Set. This is an Additive value.
Cone

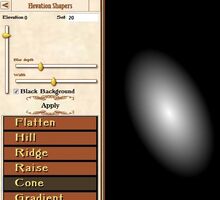
The Cone elevation shaper tool. This is with the Black Background option selected. Click to enlarge.
A Cone uses greyscale to achieve a similar effect to Hill. It's pretty obviously greyscale because you see a Greyscale Ellipse on the map when you choose this tool.
You drag it around to wherever you want the Cone added. Change Height and Width using the sliders. Alter Blur until you like what you see.
When you right click the greyscale hill, you'll see a patch of faded white added to the map. This can be difficult to see but you can check Black Background to make it more obvious.
You can drag, right click and repeat as many times as you like.
When you click Apply this is committed and you'll see the hypsometric colouring responds.
Gradient
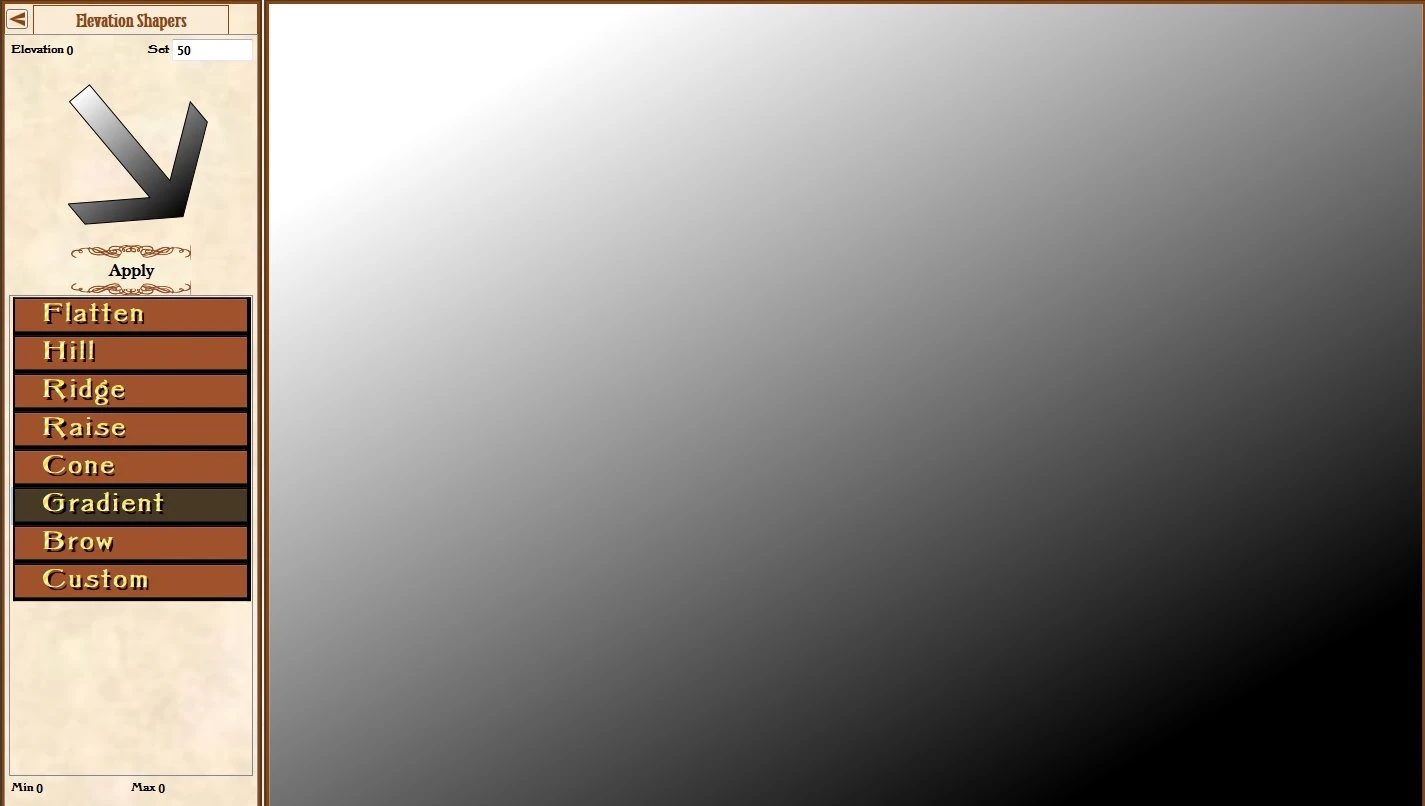
The Gradient tool applies gradient elevation in the direction of the arrow. The arrow can be rotated by using the mouse scroll wheel when over the drawing canvas. Click to enlarge.
This applies a Gradient across the map in the direction the arrow is pointing.
The greyscale effect you see on the map is interpreted to give the values.
The "Set" is the maximum value added with the gradient running from that to zero. The white parts will get the full value and black zero.
To rotate the gradient: Position the cursor anywhere on the map and scroll the mouse wheel up or down and you will see the arrow and gradient rotate.
Brow
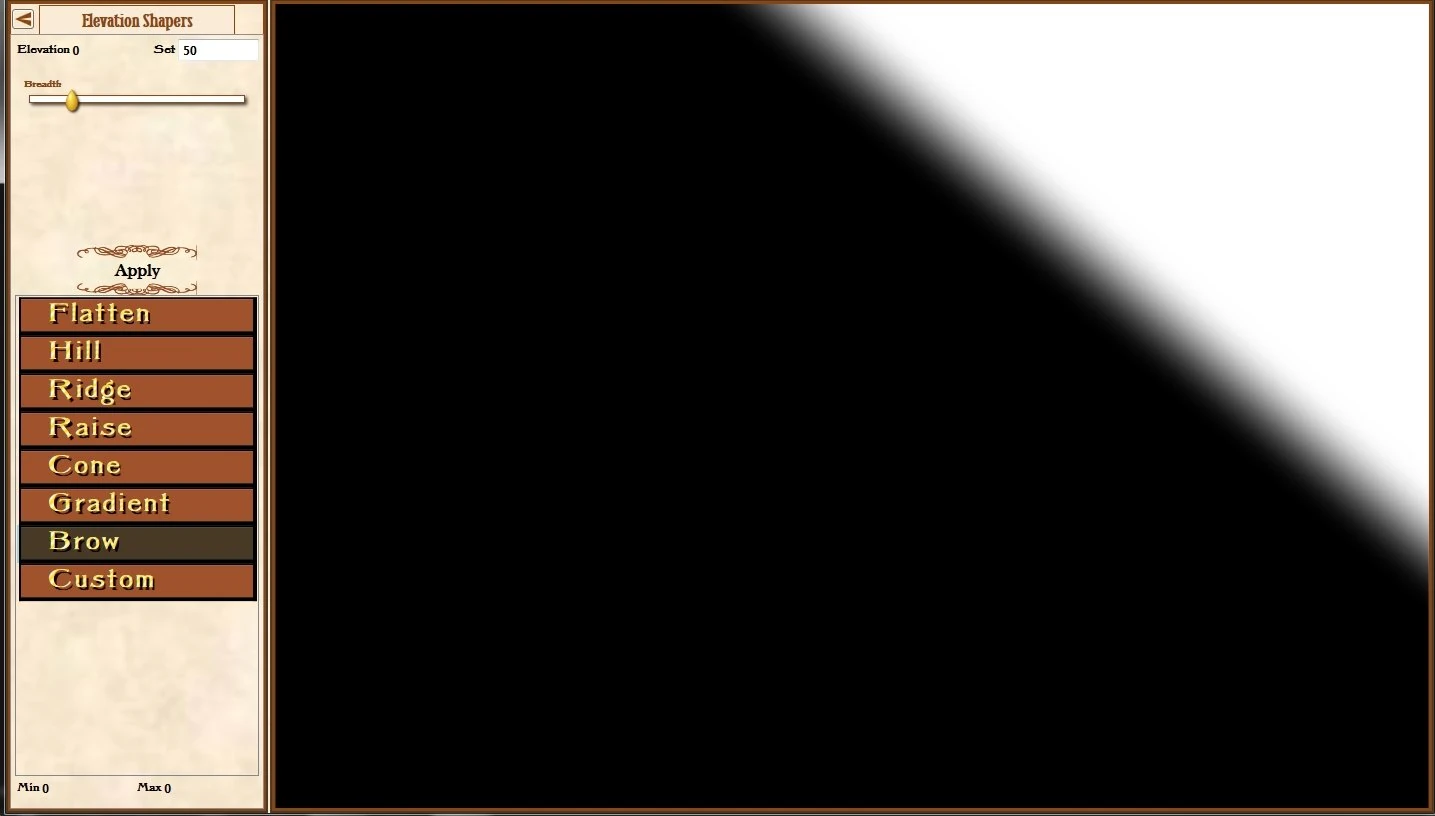
The Brow elevation shaper tool. Note the direction of the Brow can be rotated by using the mouse scroll wheel. Click to enlarge.
This is intended to allow you to create a really big valley or hill across the map.
The Set value is the maximum applied to the white part of the map.
You can rotate the picture on the map using the mousewheel and drag the effect around.
When you drag and rotate, be careful to ensure white /grey/black fills the entire map.
Custom


A greyscale file created in a paint program. Click to enlarge.
Custom allows you to apply a picture you have drawn externally in a similar way to Cone. The picture is internally converted to greyscale so you could potentially use a coloured picture which has suitable tonal values. A grey scale picture is advisable though.


The results from the above greyscale file imported using the Custom Elevation Shaper tool. Click to enlarge.
Obviously, you will need a greyscale picture you obtain from somewhere or create to use.
Some example usages:
Adding many low rises as "texture" to a map.
The Menu
The Menu appears at the top of the window. It contains numerous menu items that are logically grouped as follows:
The File Menu
These menu items deal with file options like loading and saving files.
Load Background
Select this menu item to choose a background image. These images can be scans of historical battle maps or textured paper that will make your map appear to be old.
Important note: Depending on the opacity settings (see The Layers Menu, below) the background image may not be immediately visible. This could be because the Elevation Layer is a higher layer and is set for 0% opacity, not allowing the background image to be seen at all.
Open Map
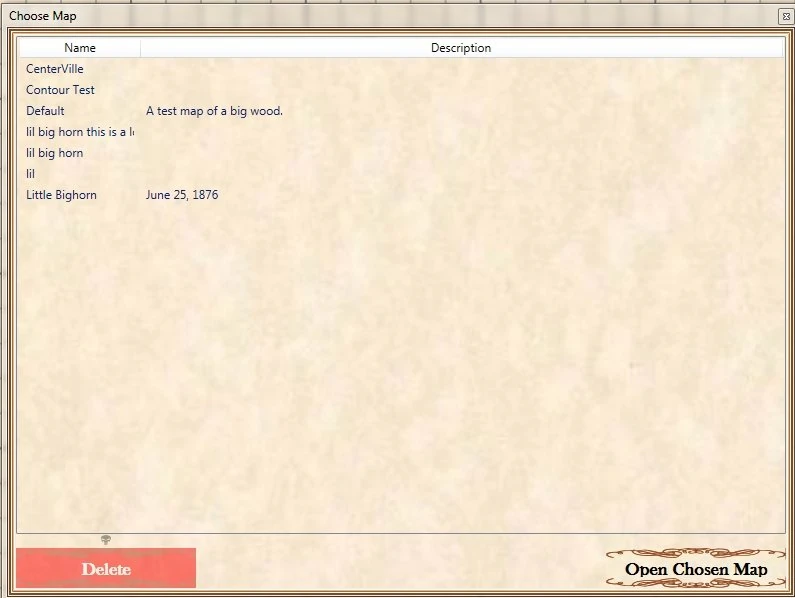
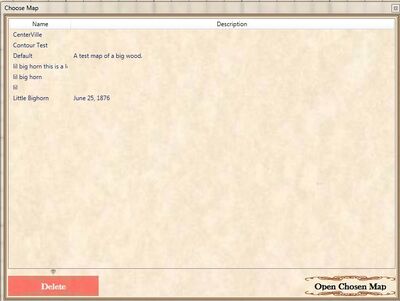
The Open Map dialog box. Note: you can also delete unwanted map files from here as well. Click to enlarge.
This will open a file selector box to select from a list of previously saved maps. Also displayed is the description of the map.
Save Map
This will open a file selector box for you to enter the name of the map file to be saved. If you have previously saved the map, that name will appear here, e.g. Save Little Bighorn.
Save As
This will open a file selector box that will allow you to save the map that you are working on with a new name.
Exit
Select this to exit the Map Editor program and return to the Desktop.
The Preferences Menu
Styling

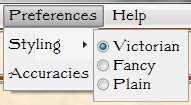
The styling menu allows you to select what style of typeface will be displayed. There are three styles of typography.
A number of different fonts are used throughout the suite for each of these styles. When you change your preference you change it for all apps in the suite.
An example of styling choice:
Victorian
![]()
Fancy
![]()
Plain
![]()
The Layers Menu

The Layers menu. Many of these menu items also have an Opacity slider to set the transparency of the desired layer as well as an on/off check box.
Background
This check box toggles displaying the Background Image on / off and the slider adjusts the opacity (transparency) of the image. Move the slider to the right for greater opacity. Important note: the Background Layer has the lowest precedence. This means that if the Elevation Layer is on and is set to 0% transparency it will block out the Background Layer.
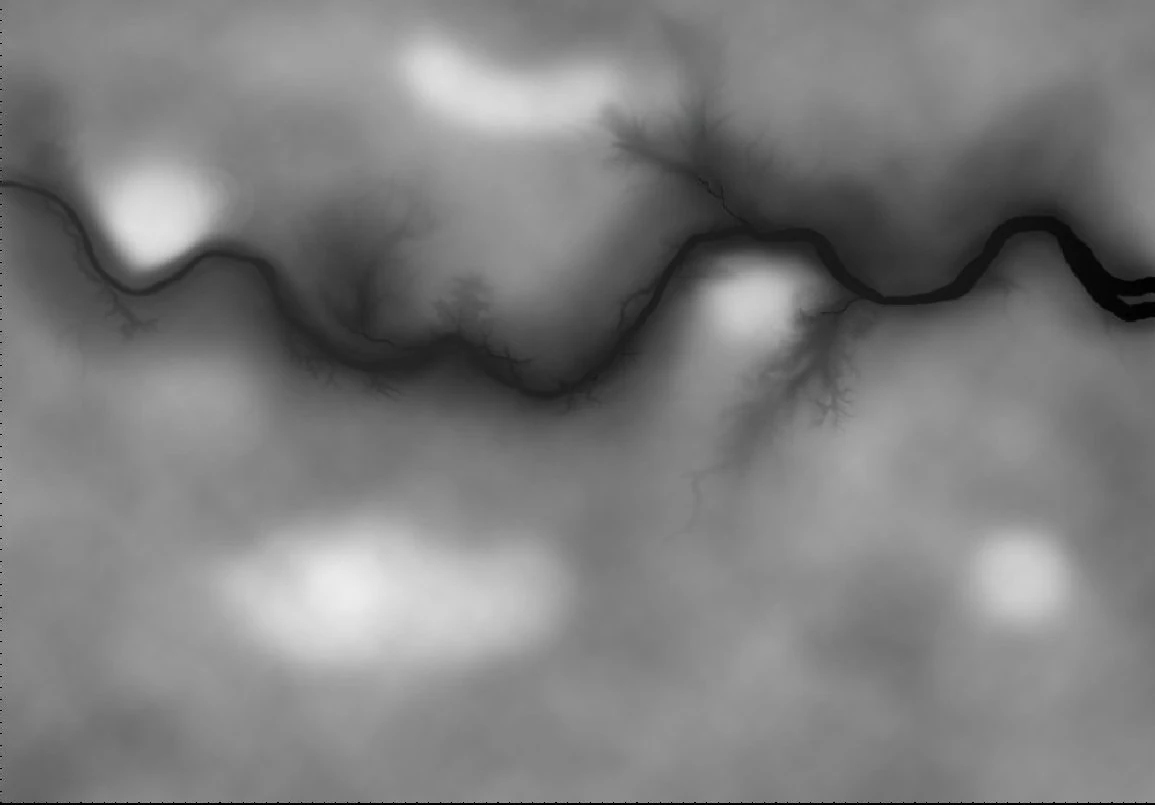
Elevation Map
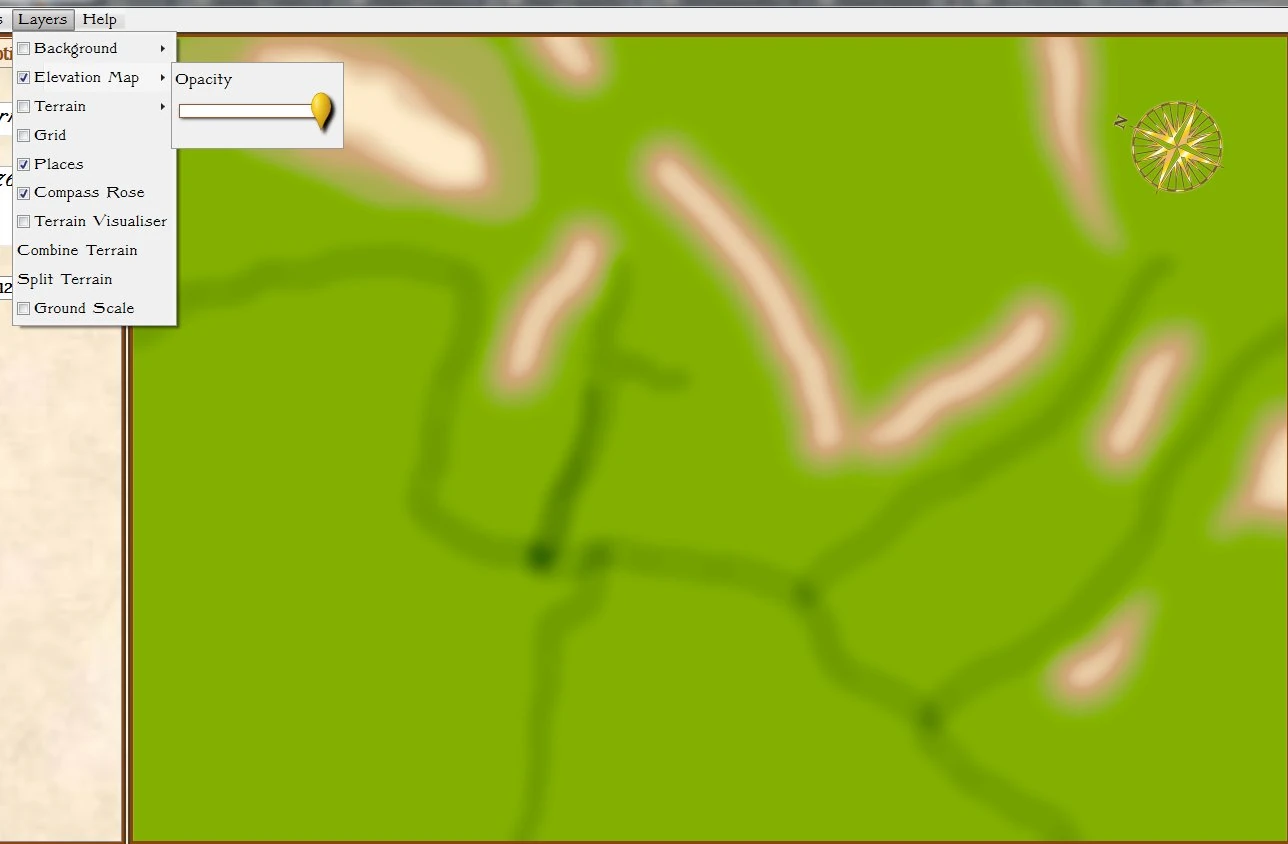

An example of the Elevation Map displayed with 0% opacity. This is from the Little Bighorn map. Note that the river and tributaries are dark (lower elevation) and the hills and ridges are lighter (higher elevation). Click to enlarge.
This check box toggles displaying the Elevation Map on / off and the slider adjusts the opacity (transparency) of the Elevation Map. Move the slider to the right for greater opacity. Important note: the Background Layer has the lowest precedence. This means that if the Elevation Map is on and is set to 0% transparency it will block out the Background Layer.
Terrain
Places
This option toggles displaying Placenames and Victory Points on/off.
Grid
This option toggles displaying the grid on/off. Important Note: the grid is not used for gameplay; rather it is a grid to help estimate distances on the map.
Compass Rose
This options toggles displaying the Compass Rose on/off. Important Note: to adjust where the Compass Rose points, go to the Edit Terrain Tab, position the cursor over the Compass Rose and use the mouse scroll wheel to rotate the compass rose.
Terrain Visualizer
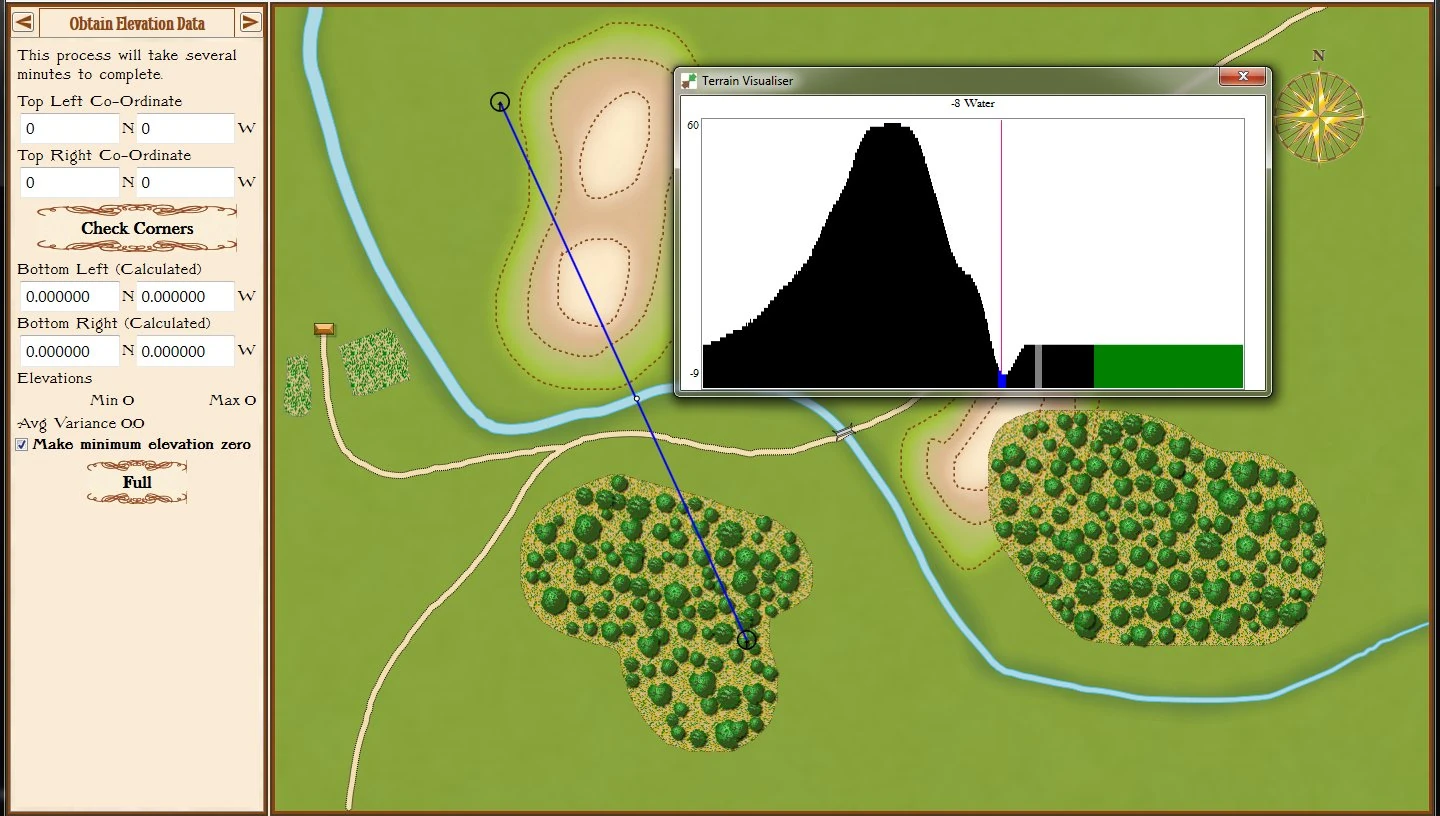
The Terrain Visualizer tool. Note that the blue line indicates where the terrain is being 'sliced'. Click to enlarge.
Select the Terrain Visualizer from the Layers tool to see a 'slice' of the map displayed in a separate window. The window can be moved about freely. As you move the cursor back and forth a vertical line will appear in the Terrain Visualizer showing information about that specific cell (terrain and height). Select the Terrain Visualizer menu item again to make this window and tool disappear. Click to enlarge.
Combine Terrain
These roads and rivers are made up of numerous segments. After selecting Combine Terrain they have been combined to one continuous segment. Click to enlarge.
Split Terrain
These roads and rivers are made from numerous segments. Select Split Terrain to separate the continuous river and roads back into the original segments. Click to enlarge.
Ground Scale
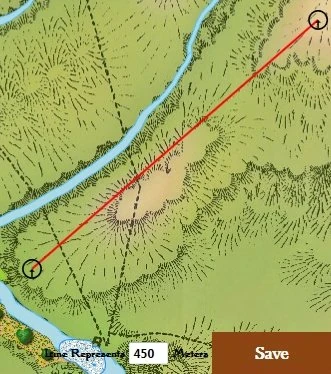
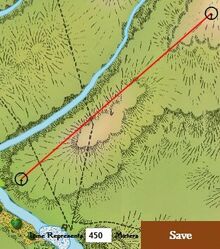
The scale of this map is set at 450 meters for the length of this red line between the two points within the circles. Enter the length of this line in meters and select Save. Click to enlarge.
Tick the Ground Scale box in the Layers menu and a line with two circles will appear. Click and drag the two circles to locations on the map that you know the distance of. Enter the distance in meters at the bottom and select Save.
The Help Menu
About the Typography

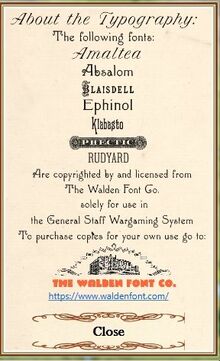
About the Typography displays a list of fonts licensed from the Walden Font Company and a link to the Walden Font Company web site. Click to enlarge.
Instructions
Selecting Instructions will bring you to this very Wiki.
About This Module
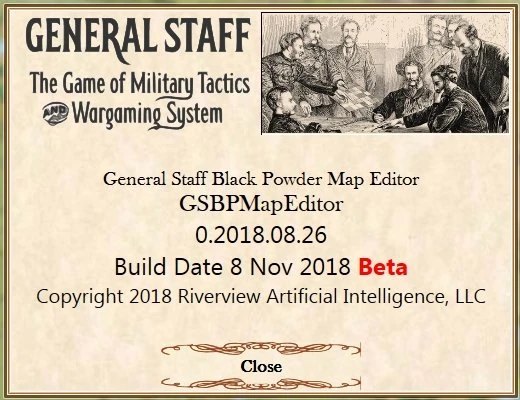
Selecting About This Module will display this information about the program including the build date for this version. Click to enlarge.
Map Scale
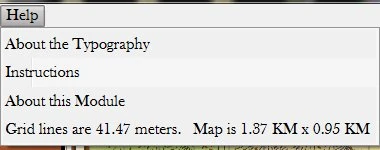
The distance between grid lines and the width and height of the map are displayed from the Map Scale menu item. Click to enlarge
Custom Options
Considerable thought and effort has gone into creating all these tools and options. The intention is to broadly cover the things most users will want. For obvious practical reasons, they cannot possibly cover all the options anyone could ever think of. In order to provide total flexibility there is a final option which is intended for the advanced enthusiast.
This allows you to add another layer in a canvas and or over ride styling. Whilst this might sound great in theory there is a catch ( isn't there always ). This is low level development in extended Application Markup Language ( XAML ).
How this works is you create a XAML file called a Resource Dictionary in:
%localappdata%\GeneralStaff\BlackPowder\Maps
This must be named CustomResources.xaml.
The content will be loaded dynamically when you run the map editor and merged into it's resources.
If there is a Canvas with an x:Key="CustomCanvas" then this will be added as an extra layer on top of everything.
You can add many things to a canvas but most likely are shapes such as Rectangle, Ellipse or Path. To define what they are you use the Tag property of these. These are matched against a specific list of terrain. They must match exactly.
List of Terrains:
Empty
Water
Swamp
BUA
Woods
Bridge
Road
Fort
Field
Mud
Fence
Hedge
Wall
Notes:
BUA = Built Up Area = buildings / city
Fort = Fortifications such as breastworks as well as an actual fort.
Example File
You can download an example file from:
https://drive.google.com/file/d/1bbbNsBW7lXjSpq371D1Tbgw47atGVxUj/view?usp=sharing
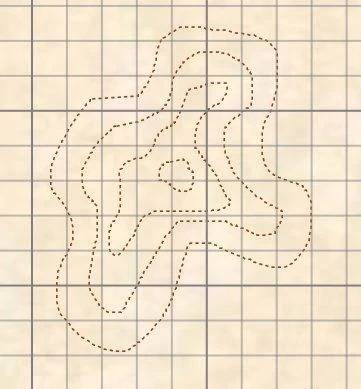
This adds a starfort shaped Path which has a Tag="Fort"
How To
If you're not a WPF developer then you will want to stick to simple stuff first. XAML is rather like HTML so you will immediately see there's xml format opening and closing tags. It is very easy to make mistakes so you will need some sort of tooling to test what you're doing immediately.
You could install Vistual Studio community ( free ) but this is quite a big install.
There are various XAML pad options which are far quicker lighter installs - such as XampPadX
https://blogs.msdn.microsoft.com/llobo/2008/08/25/xamlpadx-4-0/
Note that the Windows store XAML Pad is aimed at a different version of XAML than WPF and therefore not a good option.
In order to test my markup in XamlPadX it needs a bit of adaptation.
When you start up the app it gives you a Page to host your markup.
Add a resources section to that and paste your resource dictionary markup into that.
Then reference the canvas using a StaticResource.
This is probably way clearer when seen than described.
You should have something like:

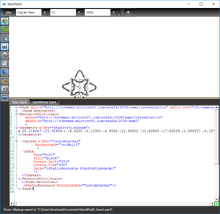
The "Geometry" is used to define a series of X,Y co-ordinates which tell it where the path is to be drawn and filled. I didn't create all these manually.
InkScape
There's a free piece of software called InkScape which is great for manipulating and creating vectors like our app uses.
If you find a picture you want to turn into a piece of terrain you can use InkScape's automatic conversion to get the data for a Geometry.
Open the bmp/jpg in InkScape and choose Path > Trace BitMap.
There are a load of options but you can either choose colour and multiple layers = multiple geometries. Or you can choose black and white. The Star Fort was done using black and white.
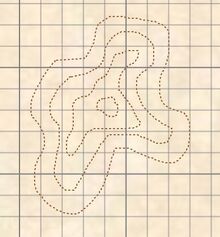
Once done click Simplify.
You will now have two layers, one is the original picture and the other your new vector representation.
Drag the vector off to one side and delete your original.
Drag the vector back to the top left corner.
Choose Save As > XAML ( checking the Silverlight option is usually best ).
You then have a text file with a .xaml extension.
If you edit in notepad there will be a load of stuff and one or more paths. These will have the characteristic long string of x,y co-ordinates. Cut and paste these into your own geometries in your own custom resource dictionary.
This is a huge subject and video explanations are planned.